US Open
Introduction
The American FootGolf League (AFGL) and River Ridge Golf Course hosted the 2018 U.S. Open in Oxnard, CA on April 26th - 29th. The tournament saw players attend from all over the world for the first major of the FIFG World Tour. The course was very difficult as it was both long (~3600 yds), sloped, fast, and occassionally windy.
I played in the tournament myself, albeit not well, and anecdotally found that certain holes were more troublesome than others, especially depending on time of day (ex, windy). As is the case in all tournaments there is always commiseration after the round and talk about the holes that ruined it all. I thought to myself, I wonder if the scores would reflect the sentiment people had of certain holes? Did a majority also suffer on Hole X? Did the time of day affect that?
This little analysis seeks to help shed some light on that as well as other fun statistics about the event. Hope you enjoy.
Data
All the charts you see here are created from a limited dataset. The dataset consists of the top 100 men’s players. This is for few reasons: 1) It’s difficult and takes time to scrape, clean, and format the data 2) 100 players is a reasonable enough sample size 3) I needed a large enough sample size of players kicking from the same tees in case I wanted to do significance testing. Unfortunately Senior’s or Women’s division couldn’t provide that. I’m optimistic that will change in the future.
Summary Stats
| hole | par | avg.score | better | eagles | birdies | pars | bogeys | doubles | worse | par.avg |
|---|---|---|---|---|---|---|---|---|---|---|
| 1 | 4 | 5.363 | 0 | 0 | 1 | 57 | 143 | 62 | 37 | 1.363 |
| 2 | 4 | 4.407 | 0 | 2 | 27 | 144 | 104 | 20 | 3 | 0.407 |
| 3 | 4 | 3.080 | 0 | 69 | 164 | 48 | 14 | 3 | 2 | -0.920 |
| 4 | 5 | 5.900 | 0 | 1 | 6 | 91 | 148 | 39 | 15 | 0.900 |
| 5 | 3 | 3.140 | 0 | 0 | 26 | 213 | 54 | 7 | 0 | 0.140 |
| 6 | 5 | 5.423 | 0 | 1 | 44 | 113 | 113 | 27 | 2 | 0.423 |
| 7 | 4 | 4.757 | 0 | 0 | 9 | 117 | 123 | 43 | 8 | 0.757 |
| 8 | 3 | 3.793 | 0 | 0 | 5 | 87 | 175 | 31 | 2 | 0.793 |
| 9 | 4 | 5.110 | 0 | 0 | 4 | 66 | 149 | 61 | 20 | 1.110 |
| 10 | 4 | 4.650 | 0 | 1 | 11 | 131 | 120 | 25 | 12 | 0.650 |
| 11 | 5 | 4.927 | 0 | 8 | 92 | 131 | 55 | 12 | 2 | -0.073 |
| 12 | 3 | 3.340 | 0 | 1 | 19 | 185 | 70 | 22 | 3 | 0.340 |
| 13 | 4 | 3.863 | 0 | 3 | 88 | 169 | 31 | 5 | 4 | -0.137 |
| 14 | 5 | 4.617 | 0 | 10 | 132 | 122 | 35 | 1 | 0 | -0.383 |
| 15 | 4 | 4.337 | 0 | 4 | 40 | 140 | 90 | 20 | 6 | 0.337 |
| 16 | 4 | 4.020 | 0 | 1 | 78 | 154 | 52 | 11 | 4 | 0.020 |
| 17 | 4 | 4.203 | 0 | 0 | 35 | 179 | 76 | 10 | 0 | 0.203 |
| 18 | 3 | 2.920 | 0 | 2 | 55 | 212 | 28 | 2 | 1 | -0.080 |
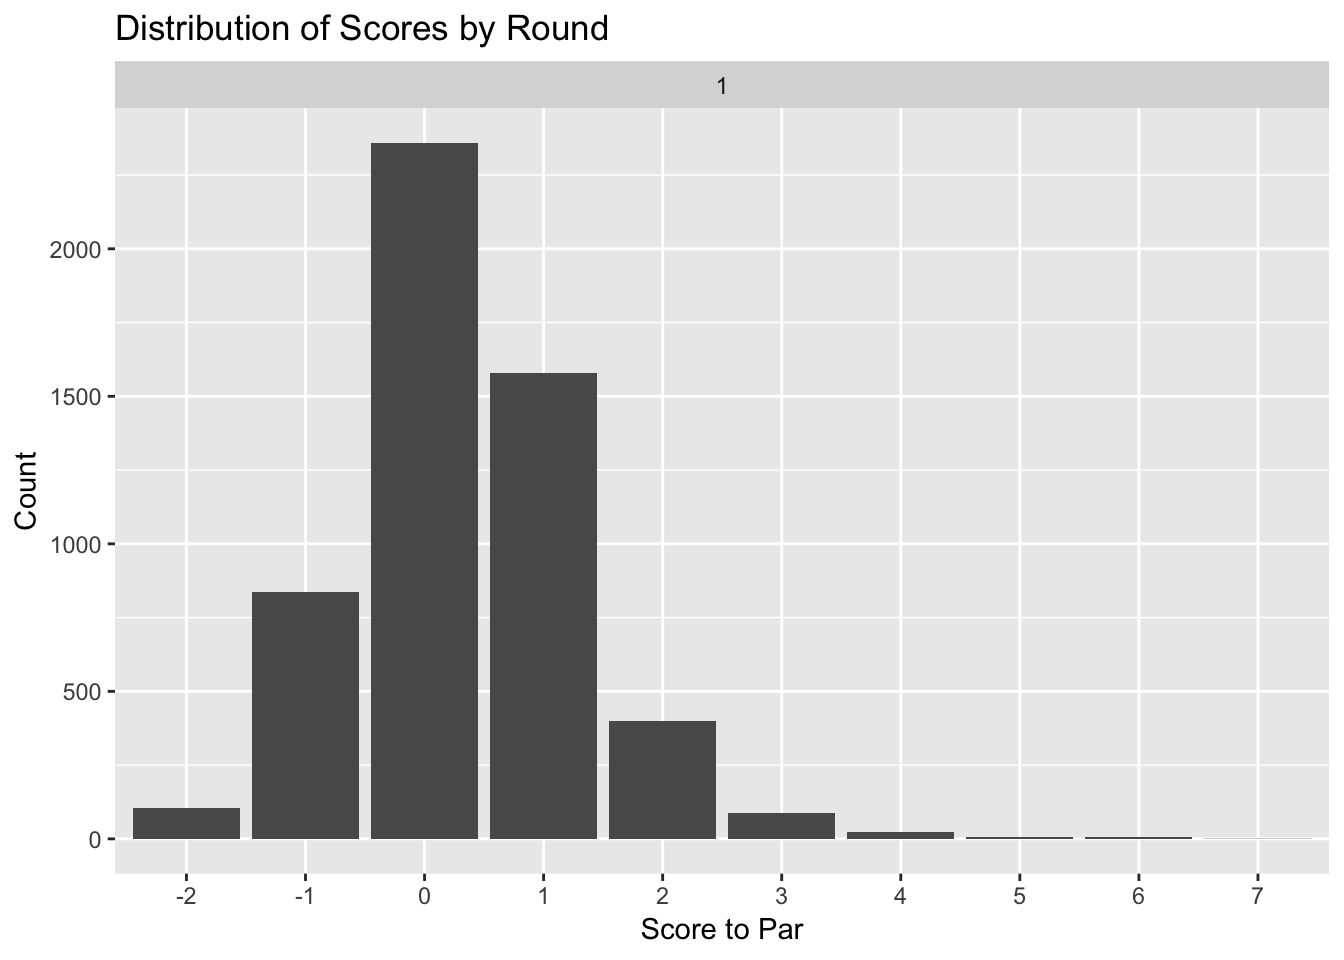
How were the scores distributed per round?
Mean scores per round were near identical with day 2 showing slightly, but not significant, improved results. Day 3 was the worst.| round | mean.score |
|---|---|
| 1 | 0.325 |
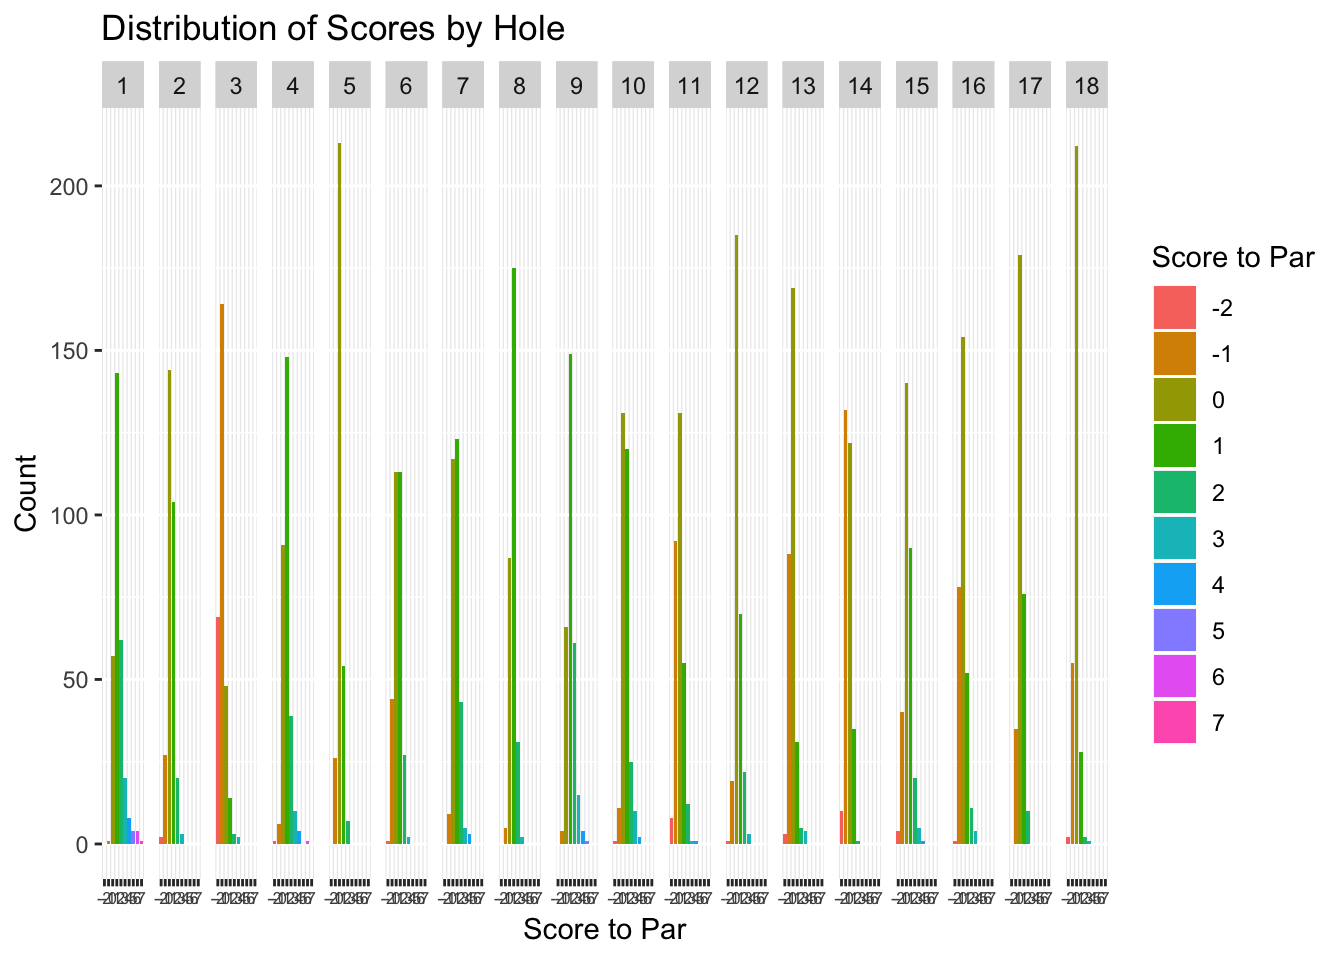
How were the scores distributed per hole?
Holes 1 and 9 show the highest mean scores. The series of 7,8,9 was quite a gauntlet on it’s own as well. Hole 3 was the easiest.
| hole | mean.score |
|---|---|
| 1 | 1.3633333 |
| 2 | 0.4066667 |
| 3 | -0.9200000 |
| 4 | 0.9000000 |
| 5 | 0.1400000 |
| 6 | 0.4233333 |
| 7 | 0.7566667 |
| 8 | 0.7933333 |
| 9 | 1.1100000 |
| 10 | 0.6500000 |
| 11 | -0.0733333 |
| 12 | 0.3400000 |
| 13 | -0.1366667 |
| 14 | -0.3833333 |
| 15 | 0.3366667 |
| 16 | 0.0200000 |
| 17 | 0.2033333 |
| 18 | -0.0800000 |
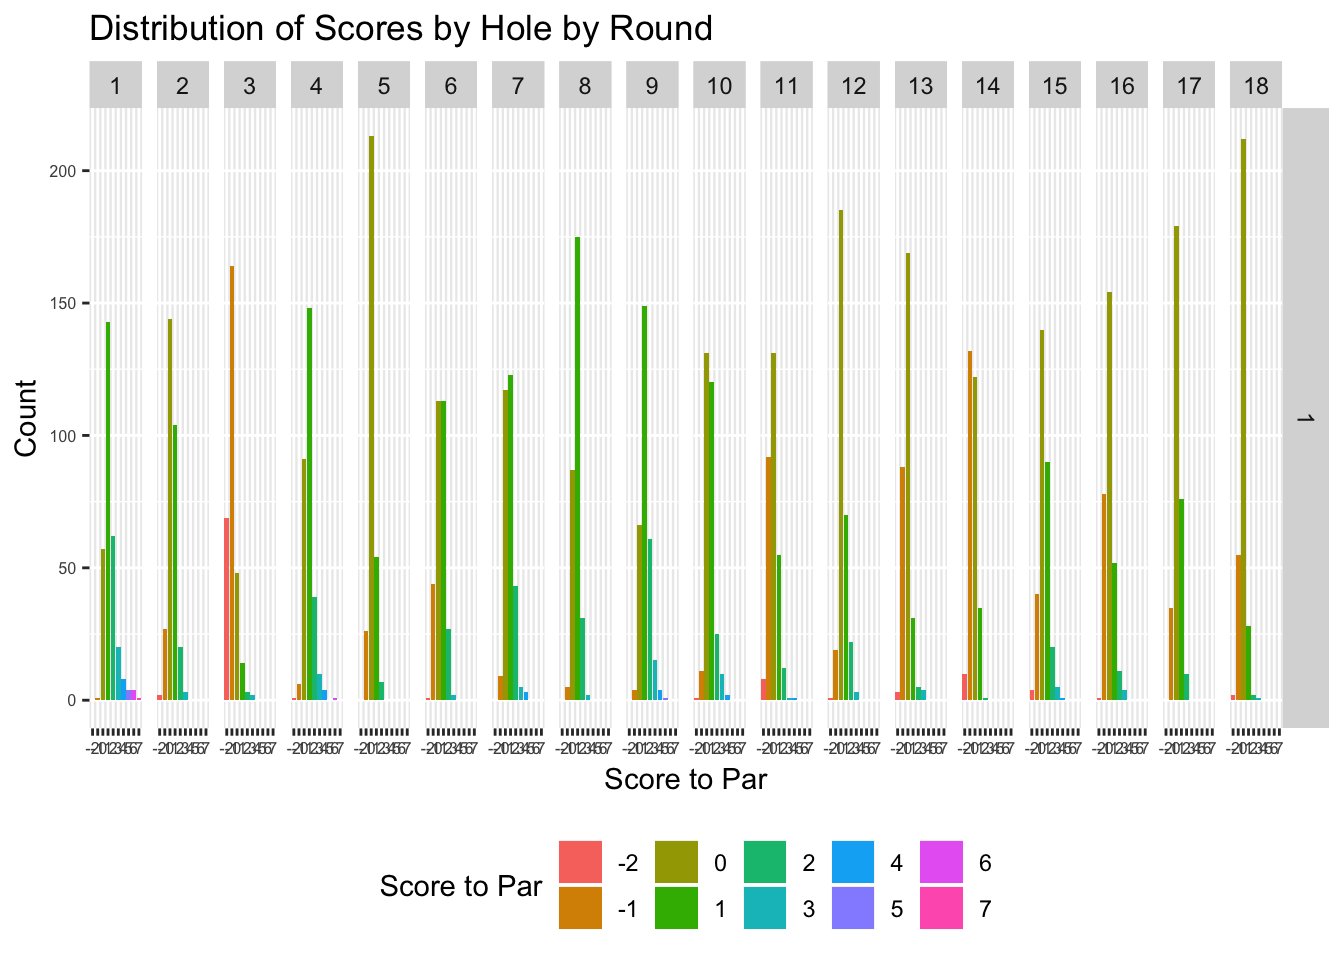
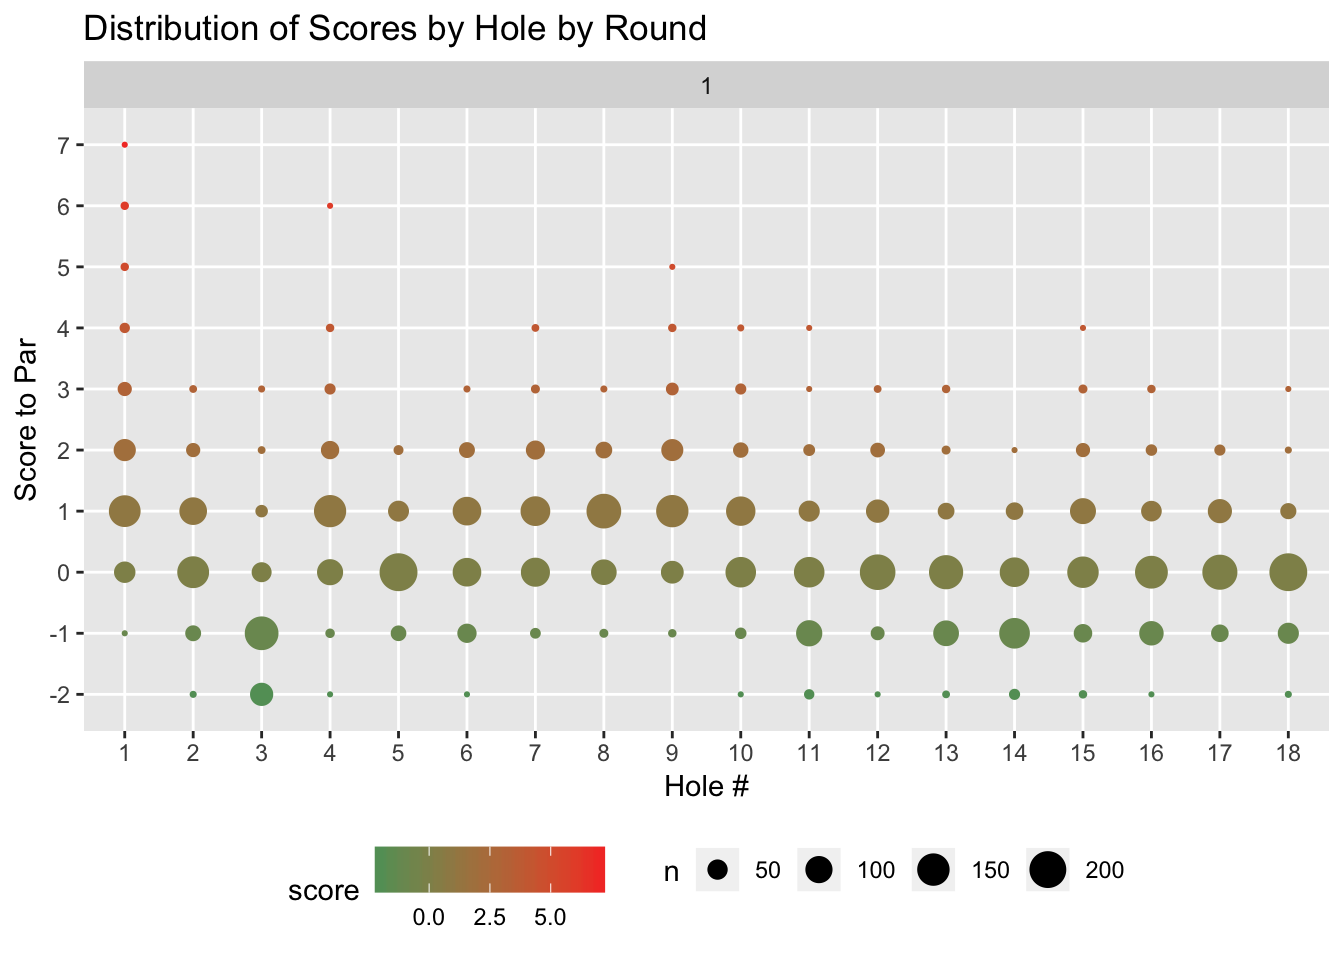
How were the scores distributed per hole per round?
The holes played pretty consistently over the three rounds. Hole 1 on round 1 and round 3 seems to have caused a lot of trouble.
| hole | round | mean.score |
|---|---|---|
| 1 | 1 | 1.3633333 |
| 2 | 1 | 0.4066667 |
| 3 | 1 | -0.9200000 |
| 4 | 1 | 0.9000000 |
| 5 | 1 | 0.1400000 |
| 6 | 1 | 0.4233333 |
| 7 | 1 | 0.7566667 |
| 8 | 1 | 0.7933333 |
| 9 | 1 | 1.1100000 |
| 10 | 1 | 0.6500000 |
| 11 | 1 | -0.0733333 |
| 12 | 1 | 0.3400000 |
| 13 | 1 | -0.1366667 |
| 14 | 1 | -0.3833333 |
| 15 | 1 | 0.3366667 |
| 16 | 1 | 0.0200000 |
| 17 | 1 | 0.2033333 |
| 18 | 1 | -0.0800000 |
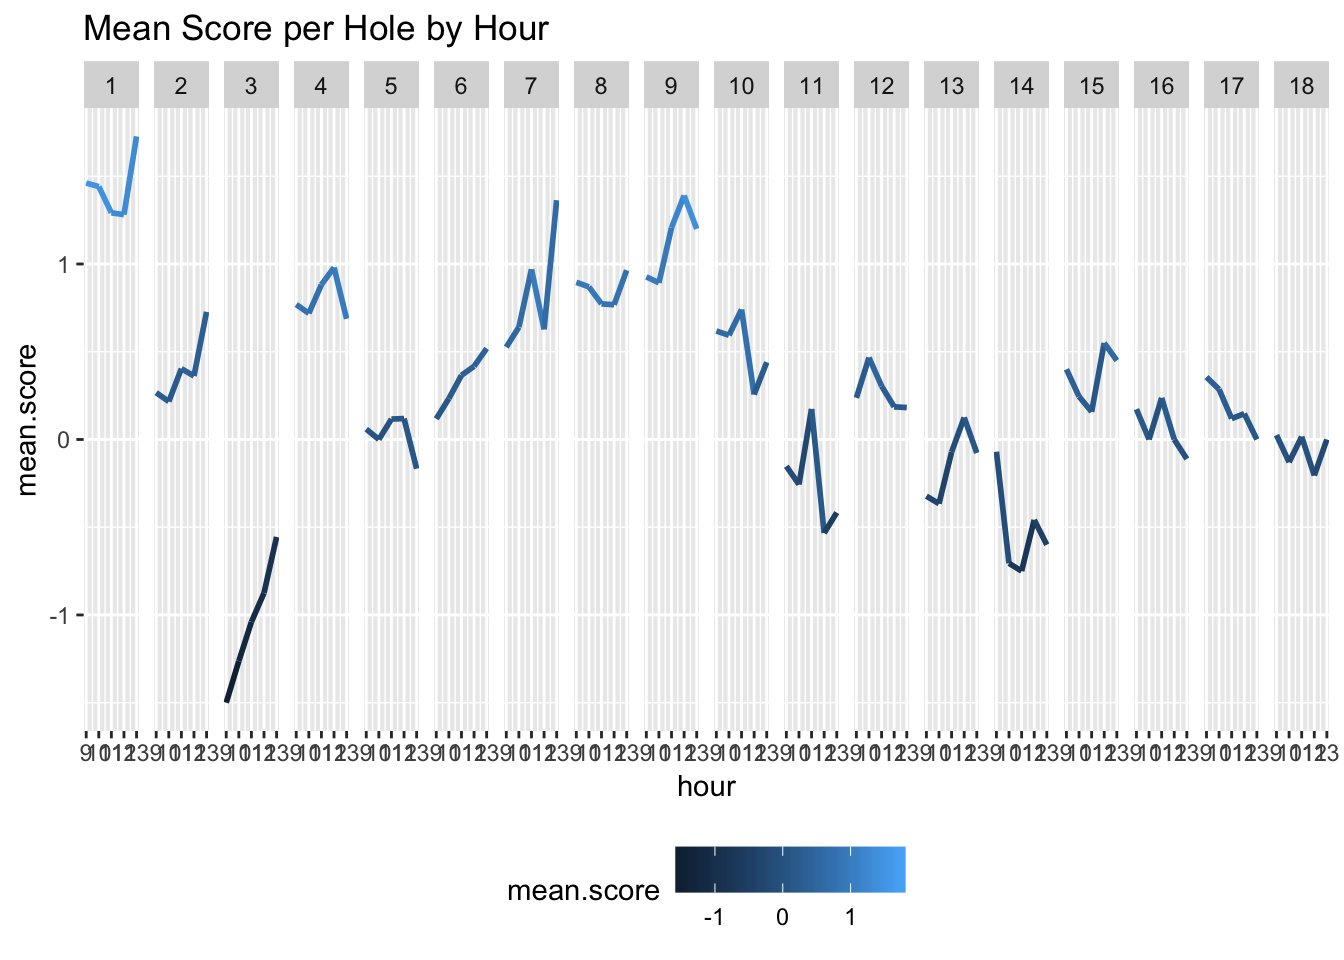
Did time of day have an impact on scoring?
Although I haven’t run any significance testing on it, it seems that the time of day one played the hole did have an impact on certain holes. On Hole 1 for example, we can see that the mean score went from near 1 over par in the morning to 2 over par by 1pm. Other holes had the opposite results. Hole 11 seems to have gotten better later in the day.