Capital Cup
Another Major, another analysis…
This time I didn’t have the pleasure of being there, but it was fun to keep up from afar. I’ve pulled data and calculated the course statistics for the tournament.
Overall Stats
Some interesting patterns emerge when calculating all the scores across all rounds.
- Holes 3, 7, 12, and 14 were the most difficult. Three of them were par 3’s and one par 4.
- Hole 6, 8, 10 were the easiest. All par 5’s. :thinking:
| hole | par | yds | avg.score | better | eagles | birdies | pars | bogeys | doubles | worse | par.avg |
|---|---|---|---|---|---|---|---|---|---|---|---|
| 1 | 4 | 173 | 4.134 | 0 | 0 | 43 | 178 | 71 | 6 | 0 | 0.134 |
| 2 | 4 | 211 | 4.007 | 0 | 1 | 47 | 203 | 47 | 2 | 0 | 0.007 |
| 3 | 3 | 114 | 3.648 | 0 | 0 | 35 | 115 | 82 | 52 | 14 | 0.648 |
| 4 | 4 | 185 | 3.674 | 0 | 6 | 113 | 152 | 26 | 1 | 0 | -0.326 |
| 5 | 4 | 159 | 3.552 | 0 | 3 | 140 | 144 | 12 | 0 | 0 | -0.448 |
| 6 | 5 | 284 | 4.007 | 3 | 75 | 151 | 57 | 13 | 0 | 0 | -0.993 |
| 7 | 3 | 146 | 3.683 | 0 | 0 | 7 | 117 | 145 | 26 | 5 | 0.683 |
| 8 | 5 | 242 | 4.253 | 0 | 14 | 199 | 84 | 3 | 0 | 0 | -0.747 |
| 9 | 4 | 168 | 3.864 | 0 | 10 | 125 | 71 | 73 | 16 | 0 | -0.136 |
| 10 | 5 | 183 | 4.159 | 3 | 49 | 154 | 78 | 12 | 0 | 0 | -0.841 |
| 11 | 4 | 177 | 3.736 | 0 | 16 | 114 | 111 | 49 | 9 | 0 | -0.264 |
| 12 | 4 | 193 | 4.559 | 0 | 0 | 8 | 135 | 137 | 19 | 0 | 0.559 |
| 13 | 4 | 129 | 3.433 | 0 | 7 | 170 | 110 | 12 | 1 | 0 | -0.567 |
| 14 | 3 | 104 | 3.465 | 0 | 0 | 65 | 114 | 46 | 59 | 13 | 0.465 |
| 15 | 4 | 209 | 4.235 | 0 | 0 | 20 | 196 | 74 | 8 | 0 | 0.235 |
| 16 | 3 | 77 | 3.423 | 0 | 0 | 43 | 117 | 111 | 28 | 1 | 0.423 |
| 17 | 4 | 188 | 3.633 | 0 | 7 | 133 | 125 | 33 | 2 | 0 | -0.367 |
| 18 | 5 | 240 | 4.451 | 2 | 60 | 65 | 122 | 35 | 0 | 0 | -0.549 |
Per Round
Round 1
| hole | par | yds | avg.score | better | eagles | birdies | pars | bogeys | doubles | worse | par.avg |
|---|---|---|---|---|---|---|---|---|---|---|---|
| 1 | 4 | 173 | 4.313 | 0 | 0 | 7 | 57 | 32 | 3 | 0 | 0.313 |
| 2 | 4 | 211 | 4.120 | 0 | 0 | 11 | 67 | 21 | 1 | 0 | 0.120 |
| 3 | 3 | 114 | 3.190 | 0 | 0 | 16 | 59 | 18 | 4 | 3 | 0.190 |
| 4 | 4 | 185 | 4.081 | 0 | 0 | 10 | 72 | 16 | 1 | 0 | 0.081 |
| 5 | 4 | 159 | 3.590 | 0 | 1 | 44 | 50 | 5 | 0 | 0 | -0.410 |
| 6 | 5 | 284 | 4.384 | 0 | 5 | 55 | 35 | 4 | 0 | 0 | -0.616 |
| 7 | 3 | 146 | 3.930 | 0 | 0 | 0 | 24 | 60 | 15 | 1 | 0.930 |
| 8 | 5 | 242 | 4.170 | 0 | 6 | 71 | 23 | 0 | 0 | 0 | -0.830 |
| 9 | 4 | 168 | 3.280 | 0 | 5 | 65 | 27 | 3 | 0 | 0 | -0.720 |
| 10 | 5 | 183 | 4.444 | 0 | 6 | 50 | 36 | 7 | 0 | 0 | -0.556 |
| 11 | 4 | 177 | 4.131 | 0 | 0 | 15 | 58 | 24 | 2 | 0 | 0.131 |
| 12 | 4 | 193 | 4.330 | 0 | 0 | 5 | 59 | 34 | 2 | 0 | 0.330 |
| 13 | 4 | 129 | 3.480 | 0 | 4 | 51 | 38 | 7 | 0 | 0 | -0.520 |
| 14 | 3 | 104 | 2.730 | 0 | 0 | 32 | 63 | 5 | 0 | 0 | -0.270 |
| 15 | 4 | 209 | 4.290 | 0 | 0 | 9 | 57 | 30 | 4 | 0 | 0.290 |
| 16 | 3 | 77 | 3.000 | 0 | 0 | 22 | 60 | 14 | 4 | 0 | 0.000 |
| 17 | 4 | 188 | 3.310 | 0 | 5 | 62 | 30 | 3 | 0 | 0 | -0.690 |
| 18 | 5 | 240 | 5.124 | 0 | 0 | 11 | 63 | 23 | 0 | 0 | 0.124 |
Round 2
| hole | par | yds | avg.score | better | eagles | birdies | pars | bogeys | doubles | worse | par.avg |
|---|---|---|---|---|---|---|---|---|---|---|---|
| 1 | 4 | 173 | 3.880 | 0 | 0 | 25 | 62 | 13 | 0 | 0 | -0.120 |
| 2 | 4 | 211 | 3.900 | 0 | 0 | 18 | 74 | 8 | 0 | 0 | -0.100 |
| 3 | 3 | 114 | 4.630 | 0 | 0 | 0 | 1 | 44 | 46 | 9 | 1.630 |
| 4 | 4 | 185 | 3.100 | 0 | 5 | 82 | 11 | 2 | 0 | 0 | -0.900 |
| 5 | 4 | 159 | 3.545 | 0 | 2 | 44 | 50 | 3 | 0 | 0 | -0.455 |
| 6 | 5 | 284 | 3.450 | 3 | 54 | 38 | 5 | 0 | 0 | 0 | -1.550 |
| 7 | 3 | 146 | 3.690 | 0 | 0 | 0 | 39 | 55 | 4 | 2 | 0.690 |
| 8 | 5 | 242 | 4.370 | 0 | 4 | 56 | 39 | 1 | 0 | 0 | -0.630 |
| 9 | 4 | 168 | 4.874 | 0 | 0 | 0 | 24 | 59 | 12 | 0 | 0.874 |
| 10 | 5 | 183 | 3.730 | 1 | 34 | 56 | 9 | 0 | 0 | 0 | -1.270 |
| 11 | 4 | 177 | 2.980 | 0 | 12 | 80 | 7 | 0 | 1 | 0 | -1.020 |
| 12 | 4 | 193 | 4.890 | 0 | 0 | 1 | 21 | 66 | 12 | 0 | 0.890 |
| 13 | 4 | 129 | 3.480 | 0 | 2 | 52 | 43 | 2 | 1 | 0 | -0.520 |
| 14 | 3 | 104 | 4.806 | 0 | 0 | 0 | 0 | 31 | 55 | 12 | 1.806 |
| 15 | 4 | 209 | 4.131 | 0 | 0 | 5 | 77 | 16 | 1 | 0 | 0.131 |
| 16 | 3 | 77 | 4.180 | 0 | 0 | 0 | 2 | 78 | 20 | 0 | 1.180 |
| 17 | 4 | 188 | 4.130 | 0 | 0 | 15 | 59 | 24 | 2 | 0 | 0.130 |
| 18 | 5 | 240 | 3.410 | 2 | 60 | 33 | 5 | 0 | 0 | 0 | -1.590 |
Round 3
| hole | par | yds | avg.score | better | eagles | birdies | pars | bogeys | doubles | worse | par.avg |
|---|---|---|---|---|---|---|---|---|---|---|---|
| 1 | 4 | 173 | 4.212 | 0 | 0 | 11 | 59 | 26 | 3 | 0 | 0.212 |
| 2 | 4 | 211 | 4.000 | 0 | 1 | 18 | 62 | 18 | 1 | 0 | 0.000 |
| 3 | 3 | 114 | 3.112 | 0 | 0 | 19 | 55 | 20 | 2 | 2 | 0.112 |
| 4 | 4 | 185 | 3.848 | 0 | 1 | 21 | 69 | 8 | 0 | 0 | -0.152 |
| 5 | 4 | 159 | 3.520 | 0 | 0 | 52 | 44 | 4 | 0 | 0 | -0.480 |
| 6 | 5 | 284 | 4.190 | 0 | 16 | 58 | 17 | 9 | 0 | 0 | -0.810 |
| 7 | 3 | 146 | 3.430 | 0 | 0 | 7 | 54 | 30 | 7 | 2 | 0.430 |
| 8 | 5 | 242 | 4.220 | 0 | 4 | 72 | 22 | 2 | 0 | 0 | -0.780 |
| 9 | 4 | 168 | 3.490 | 0 | 5 | 60 | 20 | 11 | 4 | 0 | -0.510 |
| 10 | 5 | 183 | 4.309 | 2 | 9 | 48 | 33 | 5 | 0 | 0 | -0.691 |
| 11 | 4 | 177 | 4.100 | 0 | 4 | 19 | 46 | 25 | 6 | 0 | 0.100 |
| 12 | 4 | 193 | 4.455 | 0 | 0 | 2 | 55 | 37 | 5 | 0 | 0.455 |
| 13 | 4 | 129 | 3.340 | 0 | 1 | 67 | 29 | 3 | 0 | 0 | -0.660 |
| 14 | 3 | 104 | 2.879 | 0 | 0 | 33 | 51 | 10 | 4 | 1 | -0.121 |
| 15 | 4 | 209 | 4.283 | 0 | 0 | 6 | 62 | 28 | 3 | 0 | 0.283 |
| 16 | 3 | 77 | 3.090 | 0 | 0 | 21 | 55 | 19 | 4 | 1 | 0.090 |
| 17 | 4 | 188 | 3.460 | 0 | 2 | 56 | 36 | 6 | 0 | 0 | -0.540 |
| 18 | 5 | 240 | 4.897 | 0 | 0 | 21 | 54 | 12 | 0 | 0 | -0.103 |
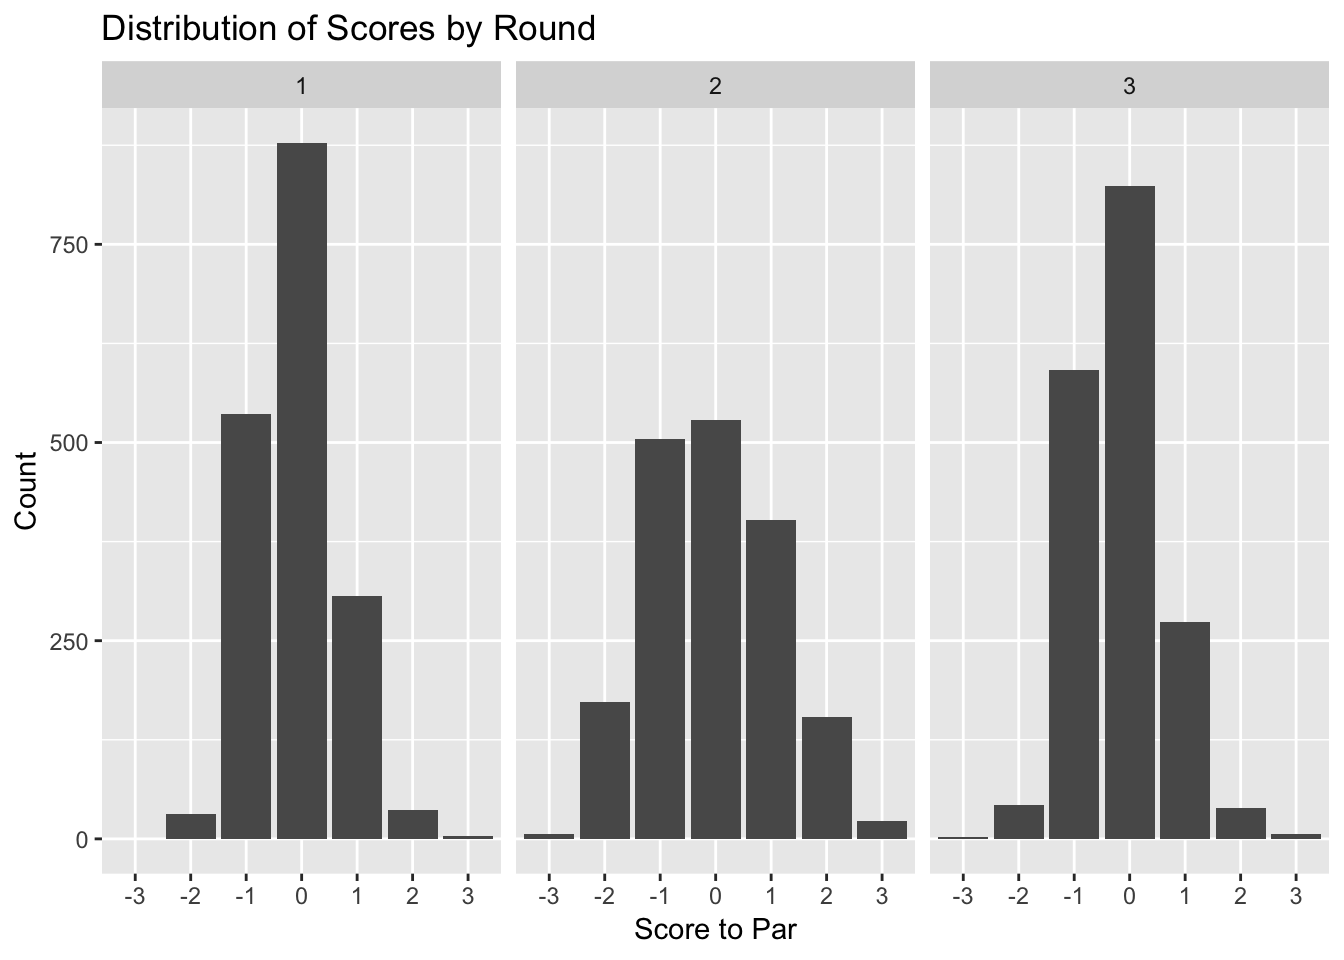
When we look at the scoring distribution across the rounds they all seem to be quite normally distributed around par. Interestingly round 2 was more difficult for some and easier for others as indicated by the larger bars for “better than par” and “worse than par”.
Read other posts